
GPU Hot Turns One Docker Command Into a Live NVIDIA Dashboard
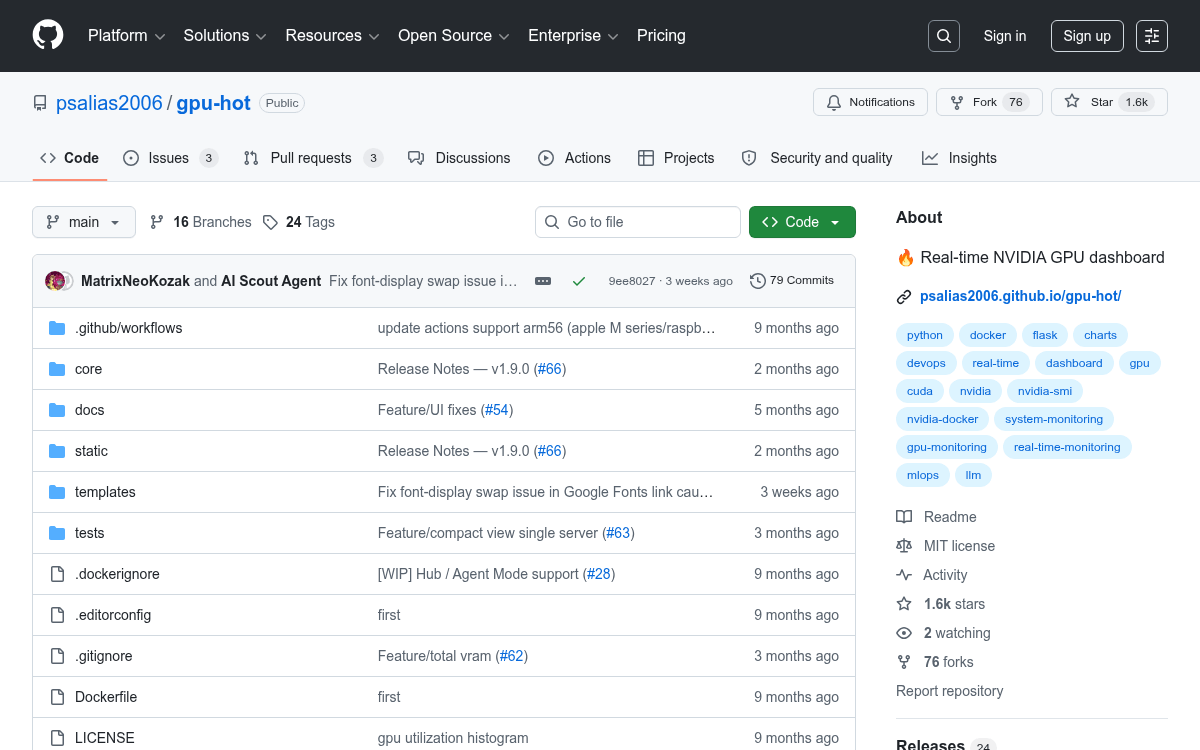
gpu-hot is a self-hosted, Docker-based NVIDIA GPU dashboard that delivers sub-second metrics and scales from a single workstation to 100+ node clusters
Takeaways
- One-command deploy: GPU Hot runs as a Docker container and opens a live GPU dashboard at
localhost:1312instantly. - Sub-second metrics: Tracks utilization, temperature, memory, power, fan speed, clock speeds, PCIe info, P-State, throttle status, and encoder/decoder sessions via NVML.
- Multi-node hub mode: A hub-and-spoke architecture lets you aggregate metrics from 100+ GPU servers into a single dashboard view.
- Process-level visibility: Shows which PIDs are consuming GPU memory and compute, with process names via
--pid=host. - Older GPU fallback: Automatically falls back from NVML to nvidia-smi for older hardware with a single env flag.
- MIT licensed, 1,500+ stars: Free, open-source, and actively maintained with 23 releases.
GPU Hot is a lightweight, self-hosted NVIDIA GPU monitoring dashboard that turns a single Docker command into a live browser-based view of everything your GPU is doing. No Prometheus stack, no Grafana setup, no cloud account. Just a container and a browser tab.
Built with Python, FastAPI, and Chart.js, it runs in Docker using the NVIDIA Container Toolkit and supports both single-node and multi-node cluster monitoring via a hub-and-spoke architecture. The project has quietly accumulated over 1,500 GitHub stars, signaling real demand for a zero-friction GPU observability tool.
One command to get started
Getting up and running on a single machine takes one line:
docker run -d --gpus all -p 1312:1312 ghcr.io/psalias2006/gpu-hot:latestThen open http://localhost:1312. That's it. Sub-second GPU monitoring in your browser, with no monitoring infrastructure and no complex dashboards. The only hard requirement is Docker and the NVIDIA Container Toolkit.

What it actually tracks
Real-time GPU metrics update sub-second, covering utilization, temperature, memory usage, power draw, fan speed, clock speeds, PCIe bandwidth, P-State, and throttle status using NVML and nvidia-smi. Beyond the GPU itself, it also pulls host-level system metrics like CPU, RAM, swap, disk, and network.