
University of Maryland Proves Social Media Feeds Betray What Users Actually Want
New study finds young adults engage with low-quality news they don't endorse, and shows how value-based curation could realign feeds with what users actually want.
 Pro
Takeaways
- University of Maryland study measures the gap between what young adults click on and what they say they value in news feeds.
- Participants engaged with low-quality content despite allocating stated preference to high-quality sources.
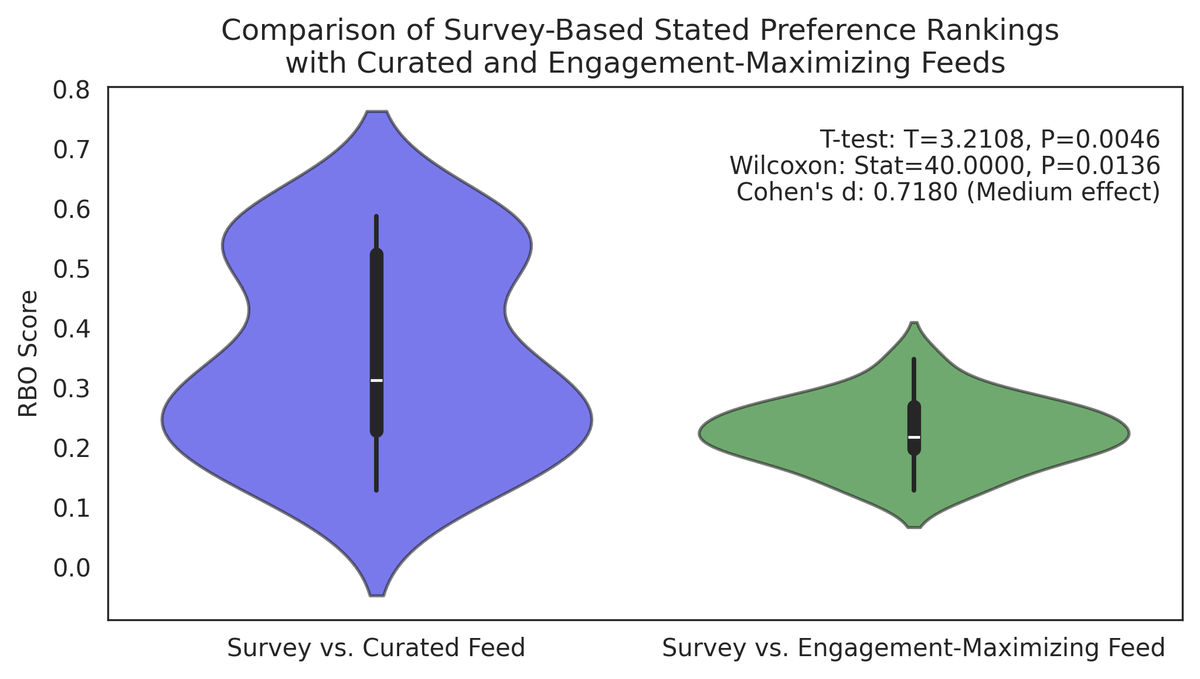
- User-curated feeds diverged from engagement-maximizing feeds more than random feeds did, measured via Rank-Biased Overlap.
- Value-based curation preserved cross-cutting political exposure, challenging the echo-chamber concern about user control.
- Six recurring value dimensions emerged: balance, trustworthiness, sensitivity, informativeness, relevance, entertainment.
- Authors propose slider-based controls and LLM-driven preference elicitation as pathways for value-aligned recommenders.
Social media feeds are trained on what you click, not what you value. A new study from the University of Maryland puts numbers on that mismatch among young adult users and, more usefully, tests what happens when people redesign their own feeds around stated values instead of engagement signals. Feeds built this way came out higher quality, more ideologically balanced, and more satisfying to users than an engagement-maximizing baseline.
Quantifying the engagement trap
Recommendation algorithms lean on behavioral data, assuming clicks and dwell time reflect what users want. In practice, people get pulled into provocative or divisive posts, the algorithm reads that as endorsement, and the loop tightens. The authors frame this as a gap between revealed preferences (behavior) and stated preferences (what you say you value on reflection).
To measure it, the researchers recruited U.S. social media users aged 18 to 24 via Prolific, a group that leans heavily on algorithmic curation while news habits and political identities are still forming. After survey screening and attrition, 20 participants completed interactive feed-curation interviews.

How the study measures what you actually want
Two methodological pieces are worth understanding, because they are the real contribution.
- Coin allocation for stated preferences. Borrowed from economics, participants received 10 coins to distribute across 8 mock posts based on how much they wanted to see similar content. More coins meant stronger stated preference. The approach sidesteps the noise of item-by-item Likert ratings.