
Sandia Borrows Radar Tricks to Map Quantum Chip Calibration in 3D
Sandia researchers port phase-shifting holography and graph-cut unwrapping into silicon spin qubit calibration, producing a 3D map of exchange phase across gate voltages.
 Pro
Takeaways
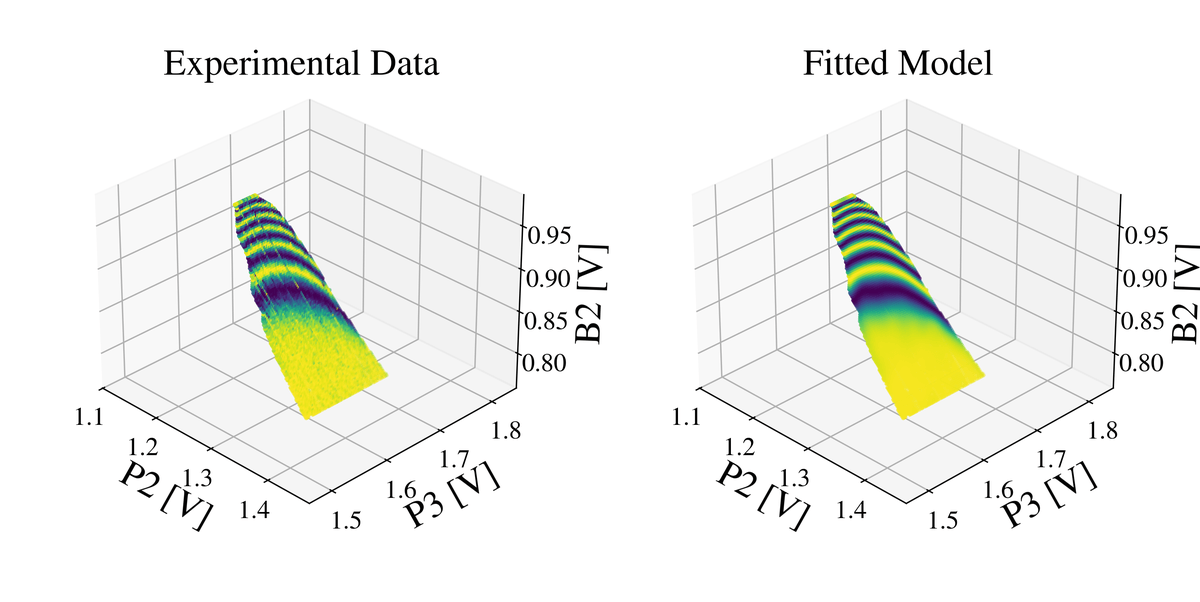
- Sandia researchers tomograph exchange phase in an Intel Tunnel Falls Si/SiGe 12 quantum dot device in 3D voltage space.
- They combine phase-shifting digital holography with the PUMA max-flow/min-cut algorithm to unwrap phase reliably.
- Data collection uses 24 scans across 6 detuning angles and 4 phase shifts, totaling roughly 21 hours.
- A multiquadric RBF spline model hits 0.093 rad training and 0.164 rad test RMSE on held-out data.
- The model locates a symmetric pi pulse point with minimal plunger-gate gradients to suppress charge noise.
- Method recovers accumulated phase phi(V), not exchange J(V) directly, and no public code was released.
Calibrating a silicon spin qubit resembles tuning a musical instrument that only speaks in cosines. When you pulse the gate electrodes that control the exchange interaction between two electrons, the measurement you get back is not the interaction strength itself, it is a probability that oscillates as the cosine of an accumulated phase. Recovering the underlying physics means inverting a cosine, unwrapping a noisy phase, and then inverting a time integral, all at once. A team at Sandia National Laboratories has just shown how to solve the first two of those problems in three dimensions, by borrowing tricks from digital holography and synthetic aperture radar.
The work, published on arXiv, tomographs the exchange phase of an Intel Tunnel Falls Si/SiGe device, the same 12 quantum dot chip that Intel has been seeding to national labs and universities to broaden access to silicon spin qubit research.
Why exchange resists direct measurement
In spin qubit platforms, information is encoded using the spins of electrons confined in individual quantum dots, and two-qubit operations rely on the Heisenberg exchange coupling J between neighboring electrons. These interactions are sensitive to nanometer-scale variations in device structure, and are therefore unique to each interacting pair of dots on a chip. Every pair needs its own calibration curve mapping gate voltages to exchange strength.
Experimentally, what you actually measure is the singlet return probability, which behaves like the cosine of a phase that is itself the time integral of J over the pulse. You get a chirped fringe pattern, and you need to work backwards. Prior calibration approaches either fit the raw signal to an analytical expression or extract voltage coordinates where the phase hits integer multiples of pi and interpolate between them. Those tricks work along a 1D cross section, but exchange pulses live in a 3D voltage space defined by two plunger gates and one barrier gate that must be pulsed together to keep the double dot symmetric. Voltage noise and pulse skew push the actual trajectory off that ideal line, and modeling those effects requires a real 3D map.