
Researchers Tested Magic: The Gathering Dashboards on 83 Players and Found Surprising Results
A design study of a Commander format dashboard finds heatmaps beat scatterplots, and players want local, outcome-driven views over global aggregates.
 Pro
Takeaways
- Design study for a Magic: The Gathering Commander dashboard built with Playgroup.gg, tested with 83 players.
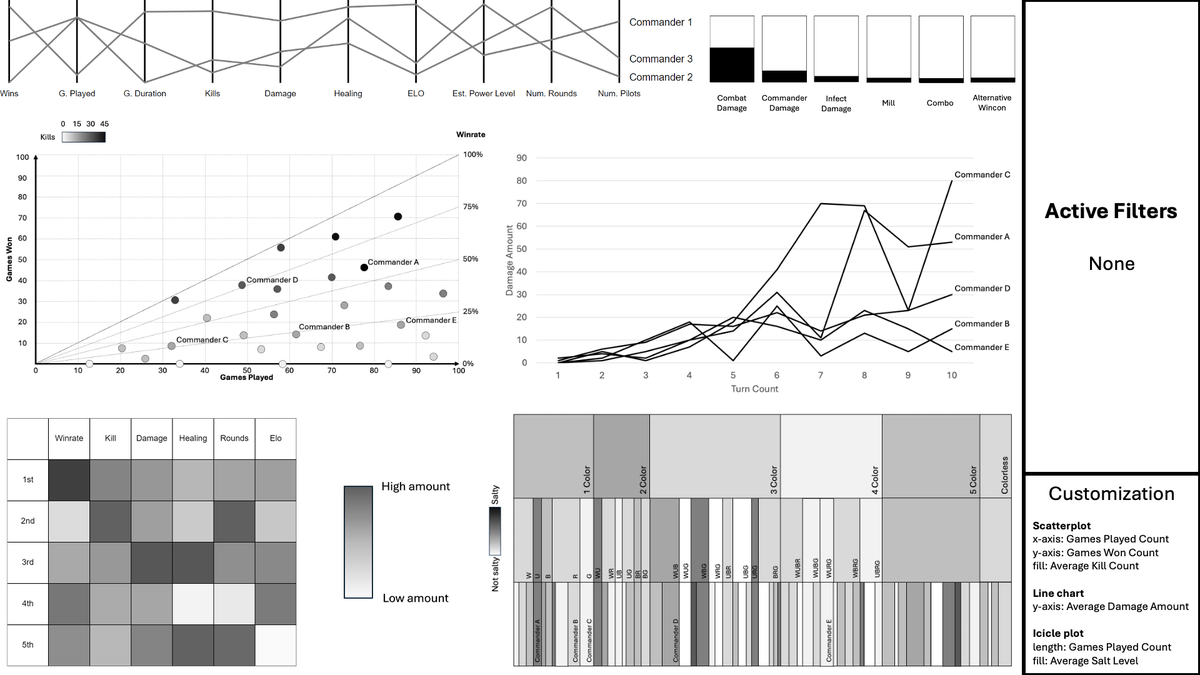
- Heatmaps scored 98% comprehension; scatterplots only 67% and icicle plots dropped to 49% for precise lookups.
- Players prioritized win rate and wins/losses; rejected peripheral metrics like dice rolls and pause duration.
- Playgroup and user-scoped views beat global aggregates, suggesting local context outperforms population dashboards.
- Users demanded customization, progressive disclosure, hover-to-reveal, and brushing across linked charts.
- Materials, code and questionnaires posted openly on OSF for replication.
Trading card game analytics tend to obsess over deck lists and card prices, but almost nothing peer-reviewed exists on how players actually want to see their gameplay data. A new design study out of the HCI community takes a swing at that gap by building and testing a visualization dashboard for Magic: The Gathering's Commander format, the game's most popular way to play.
The paper reports the first two phases of a full design study, running from domain analysis through a mock dashboard tested with 83 players. Its findings extend past Magic to a set of design rules that translate to any engagement-driven dashboard: which charts land, which ones confuse, and which comparisons users actually care about.
Commander is a weird analytics target
The format formerly known as Elder Dragon Highlander is built around 100-card singleton decks, a legendary creature or planeswalker that defines color identity, four-player pods starting at 40 life, and a unique Commander Damage rule where 21 combat damage from a single commander ends a player. With a card pool north of 20,000 unique cards and heavy table politics, the strategic surface area is huge.
Community APIs like Scryfall and MTGJSON, plus deck-builders like Archidekt and Moxfield, cover card data well, but no research addresses visual analytics for actual gameplay data. The authors partnered with