
INRIA's GeoPl@ntNet Maps 10,000 Plant Species Across Europe at 50-Meter Resolution
A research team unveils an interactive Europe-wide biodiversity mapping platform powered by CNN ensembles and a species-focused BERT model at 50-meter resolution.
Takeaways
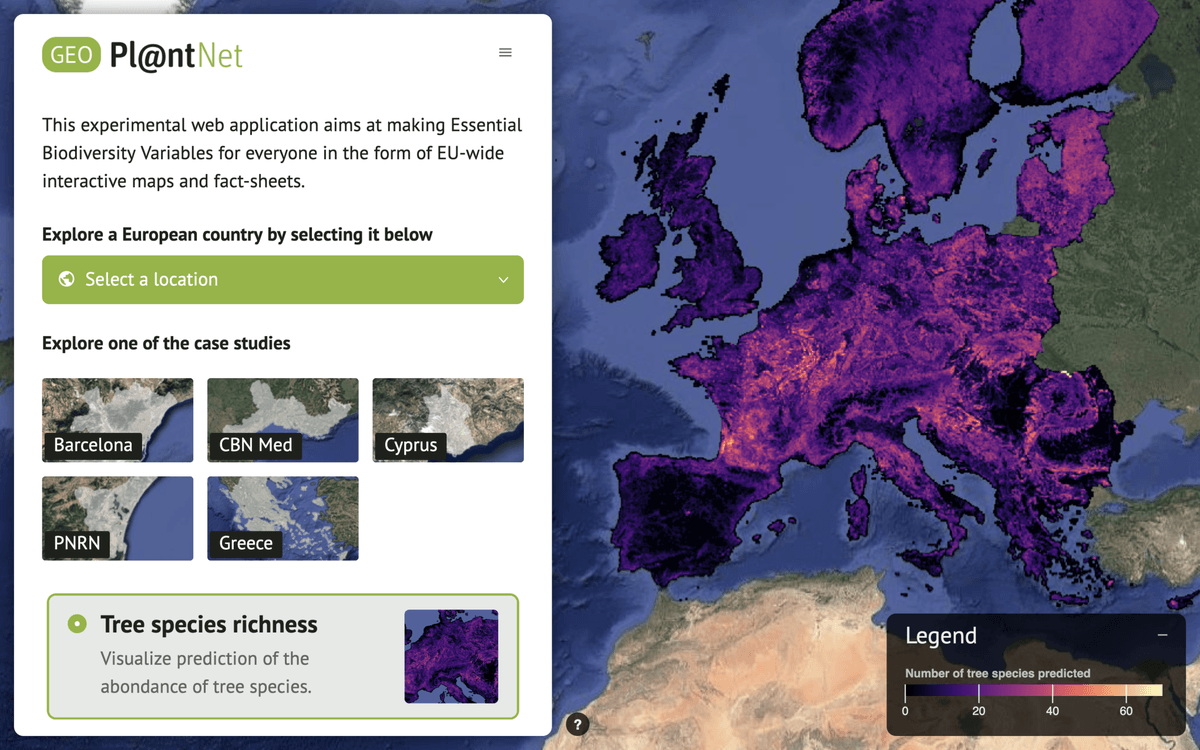
- GeoPl@ntNet maps 10,000+ plant species, 200+ habitats, and 7 biodiversity indicators across Europe at 50m resolution.
- Cascading pipeline pairs a ResNet-6 ensemble Deep-SDM with Pl@ntBERT, a BERT trained on species co-occurrence.
- Deep-SDM hits 0.931 AUC and 0.908 Recall@250; Pl@ntBERT reaches 76.3% at EUNIS Level 1.
- Trained on GeoPlant: 5M presence-only observations and 90K presence-absence vegetation plots.
- Web app in VueJS+Leaflet serves layers as WMS streams, backed by MapProxy and TiTiler over ~15TB.
- Available at geo.plantnet.org; users can draw regions and export JSON reports.
A team from INRIA, CIRAD, and LIRMM has launched GeoPl@ntNet, a web application that turns years of ecological modeling work into something you can click through in a browser. Users can explore AI-generated maps of species distributions, habitat types, and biodiversity indicators across Europe at resolutions as fine as 50x50 meters. Behind the interface is a stack that chains convolutional networks with a domain-specific language model to predict what grows where.
Why biodiversity maps are hard
Ecologists have long wanted continent-scale species maps at fine resolution, but field surveys are sparse and unevenly distributed. Citizen science apps have flooded the field with observations, yet those skew toward roads, cities, and charismatic species. The modeling problem is figuring out how to fuse messy occurrence data with satellite, climate, and terrain layers to predict plant communities in places nobody has ever surveyed.
GeoPl@ntNet combines plant assemblage prediction with the recognition that distributions are shaped by broad environmental requirements, micro-environmental conditions, dispersal limitations, and species interactions. Predicting community composition and habitat type from those factors is difficult but essential for conservation and restoration work. The result is a system that outputs species probabilities alongside derived ecological summaries a non-modeler can read.
Chaining an SDM into a habitat classifier
The pipeline runs in two stages. First, a species distribution model (Deep-SDM) predicts which plants are present in each 50m cell. Those predicted assemblages are then fed into a habitat classifier (Deep-HDM) called Pl@ntBERT.