
HKUST's ChartFinder Beats Every Open Model at Finding Charts in Massive Dashboards
A new benchmark exposes how chart retrieval models fail at semantic reasoning, and a training pipeline built on synthesized insights closes the gap.
 Pro
Takeaways
- CRBench introduces 21,862 charts and 326 queries built with a target-and-distractor design for realistic BI retrieval evaluation
- ChartFinder, a fine-tuned Long-CLIP, reaches 66.9% NDCG@10 on precise queries, a 11.58 point gain
- Training uses 207,498 synthesized insights across visual, statistical, and task-oriented levels for 69,166 charts
- Zero-shot transfer to VisText and Chart-to-Text also beats all baselines, showing the pipeline generalizes
- Replacing CLIP's center-crop with direct resize alone adds roughly 13 NDCG@10 points on chart tasks
- Benchmark, model weights, and training pipeline will be open-sourced on acceptance
Finding the right chart inside a business intelligence dashboard sounds trivial until you actually try it. Type a query like hotel booking distribution in Europe into a repository of thousands of visually near-identical bar and pie charts, and most modern vision-language models fold. A new paper from HKUST(GZ) and Huawei Cloud introduces both a benchmark that exposes this weakness and a training recipe that fixes it, producing a model called ChartFinder that beats every open baseline tested.
Why CLIP-style models fumble chart search
Text-to-chart retrieval systems that let users find relevant visualizations from natural language queries have become increasingly valuable, but existing benchmarks were never built for the job. Chart-to-text datasets like VisText and Chart-to-Text were designed for generation tasks such as captioning. Their captions are long and descriptive, and they typically pair each chart with one or two texts, which does not reflect how BI users actually search.
The authors argue that real-world queries fall into two camps: precise questions targeting specific data, and fuzzy exploratory prompts. Both require understanding a chart's analytical semantics, not just its pixels. The problem gets worse when charts exist only as static images without accessible metadata, a common scenario where visual-based methods inherently struggle.
CRBench: a target-and-distractor gauntlet
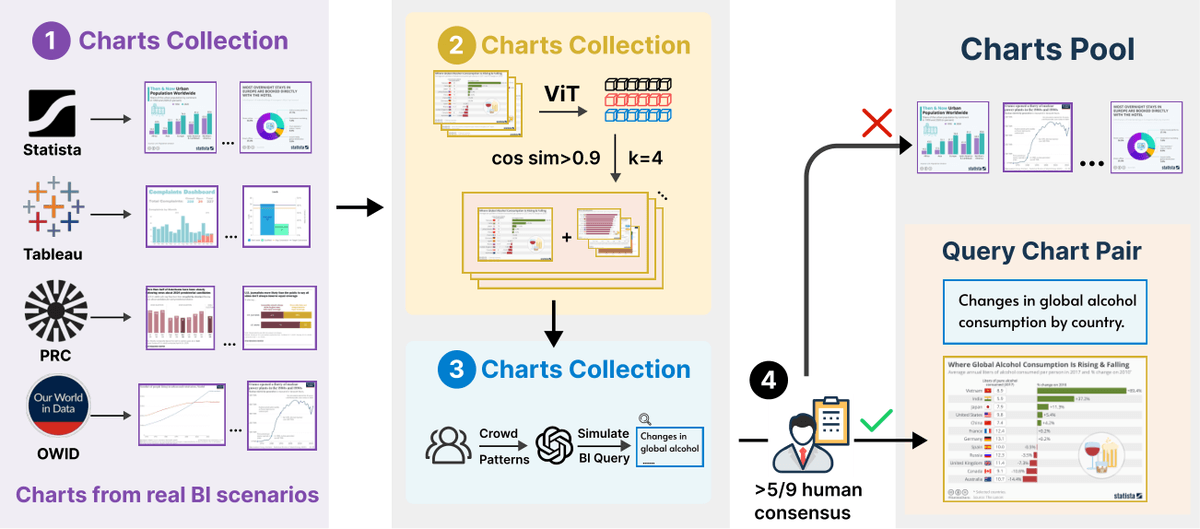
CRBench contains 326 text queries and 21,862 chart images, with all query-chart labels verified by crowd workers to capture the diversity of real user needs. Charts were pulled from four sources heavily used in analytics work: Tableau Public, Statista, Pew Research, and Our World in Data.