
Columbia Pits GPT-4o Against 96,000 Humans to Expose AI Survey Failures
A new statistical framework profiles how far LLM simulators drift from real human populations, ranking GPT-4o, GPT-5 mini, Llama 3.3, and Qwen 3.
Takeaways
- Columbia researchers introduce a model-free way to measure sim-to-real gap via calibrated quantile curves. Read the paper.
- Method builds confidence sets around unobserved population parameters, then takes empirical quantiles of worst-case pseudo-discrepancies.
- Finite-sample guarantees hold under heterogeneous per-scenario sample sizes, using DKW and Hoeffding-Serfling inequalities.
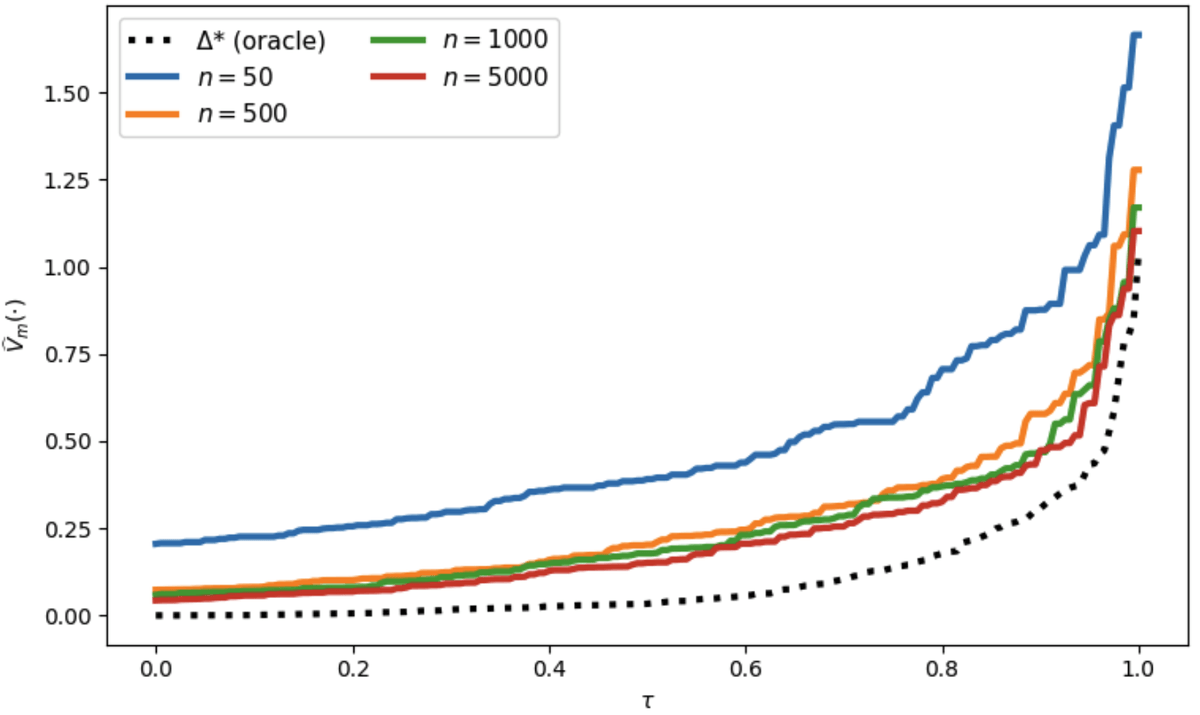
- On WorldValueBench, GPT-4o beats GPT-5 mini, Llama 3.3 70B, and Qwen 3 235B across all quantile levels.
- All four LLMs outperform uniform baseline on 80%+ of questions but fail on tail scenarios.
- Framework supports CVaR, AUC, and confidence sets for real distributions in new unseen scenarios.
When a language model plays the role of a survey respondent, a factory worker, or a household making energy decisions, how do you know whether its answers actually match what humans would say? A team from Columbia University has proposed a black-box method for measuring the gap between simulated and real populations, then used it to benchmark four flagship LLMs against roughly 96,000 real survey respondents.
The paper, by Garud Iyengar, Yu-Shiou Willy Lin, and Kaizheng Wang, introduces a model-agnostic way to build a full risk profile of a simulator across scenarios rather than a single average error number. It applies equally to categorical survey answers, continuous sensor data, and other output spaces.
The sim-to-real gap has an observability problem
Standard predictive inference methods are inapplicable because they seek to quantify uncertainty in observable outputs rather than their underlying population parameters. For any given scenario, like one survey question, both the real population and the simulator are only accessible through finite samples. The true discrepancy between their latent distributions is never directly observed.
Worse, the amount of data varies wildly across scenarios. Some questions might have 500 human responses, others 10,000. Averaging a single error metric across scenarios hides rare but consequential failures, which is exactly the kind of thing you want to catch before deploying an LLM as a stand-in for a customer panel or a policy focus group.

Confidence sets around what you cannot see
The core trick is to stop trying to estimate the true discrepancy directly and instead build a conservative proxy. For each scenario, the method constructs a confidence set around the unknown real-world parameter using off-the-shelf concentration bounds (Chernoff-Hoeffding for multinomial answers, Hoeffding for bounded outcomes, a Wasserstein bound for nonparametric distributions).