OpenCode Fixes the Metric That Made Chatty AI Models Look Dominant
OpenCode's public data dashboard now ranks models by unique users, fixing a bias where verbose models looked more popular than they actually were
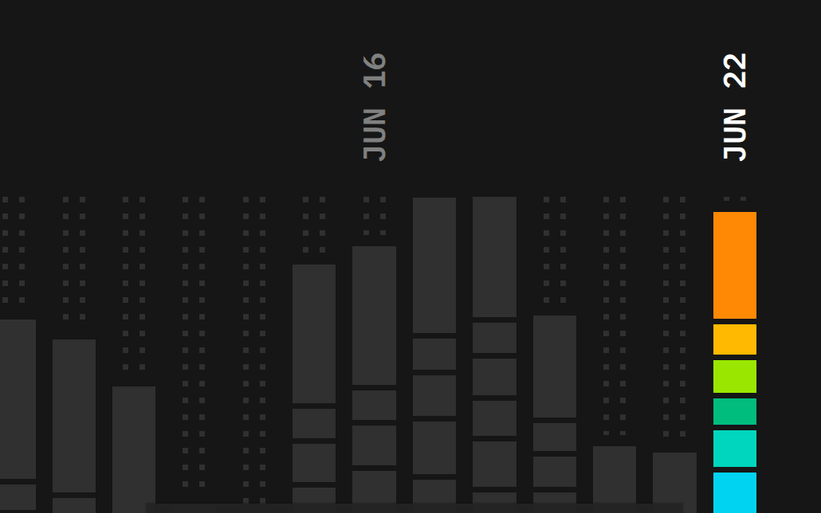
- New metric: OpenCode added unique user rankings to its public data dashboard, fixing bias from token-heavy models inflating raw counts.
- Token skew is real: GLM-5.1 costs $24/1M tokens vs DeepSeek V4 Flash at $0.28/1M -- a 85x difference that distorts token-volume rankings.
- Top by tokens: DeepSeek V4 Flash leads with 8.1T tokens, followed by DeepSeek V4 Pro at 3.9T and MiniMax M3 at 1.6T (up 150% WoW).
- Cache ratios are high: 88-97% of input tokens are served from cache across top models, keeping agentic session costs manageable at scale.
- Platform scale: OpenCode has 160K+ GitHub stars and 7.5M monthly active users, processing ~2.3-2.8T tokens per day.
- Free and public: The data dashboard is openly accessible and now the most honest real-production signal for model adoption available.
OpenCode's public data dashboard just got a new ranking dimension: unique users per model. It sounds like a small tweak, but it fixes a real distortion that's been quietly skewing how the community reads model adoption.
The token count problem
OpenCode tracks usage across its platform, which now counts over 7.5 million developers every month. Their existing leaderboard ranked models by raw token volume. The issue? Some models are just naturally chatty. They write longer responses, use more tokens per session, and end up looking dominant on a token chart even if only a handful of power users are driving all that volume.
The team flagged this directly: some models are token-heavy, so they skew upwards in rankings. Unique people using a model is a more accurate signal of real adoption. So they built it.
What the numbers actually show
The gap between token rank and user rank is significant. DeepSeek V4 Flash sits at #1 by tokens with 8.1 trillion, and DeepSeek V4 Pro at #2 with 3.9 trillion. But those numbers are partly a function of how those models are used in agentic sessions, not just how many people chose them.
Compare that to session cost data, which tells a cleaner story about model behavior:
- mimo-v2.5: $0.06 per session (cheapest, lightest)
- deepseek-v4-flash: $0.08 per session
- minimax-m3: $0.27 per session
- kimi-k2.7-code: $1.08 per session
- glm-5.1: $1.18 per session (most expensive)
Token pricing varies from $0.28/1M for DeepSeek V4 Flash and Mimo V2.5, all the way up to $24/1M for GLM-5.1. A model at 85x the per-token price will naturally dominate token charts even with a fraction of the users. The unique user metric cuts through that noise.
Cache ratios are quietly doing heavy lifting
One underappreciated number in the dashboard: cache ratio, which is the share of input tokens served from cache, runs between 88% and 97% across top models. In agentic coding sessions, the agent repeatedly sends the same system prompt, file context, and tool definitions with every call. Prompt caching (where the model provider stores and reuses those repeated inputs at a steep discount) is what keeps costs manageable at scale. The platform is currently processing around 2.3-2.8 trillion tokens per day, so even a few percentage points of cache ratio difference translates to meaningful cost swings.
The broader picture
OpenCode has become the most-adopted open-source coding agent, with 160K+ GitHub stars and 7.5M monthly active users. It offers model-agnostic access to 75+ providers including Claude, GPT, Gemini, DeepSeek, and local models via Ollama, plus LSP integration that feeds compiler diagnostics back to the model -- a feature no other major tool currently matches. Because it's a bring-your-own-key setup, your cost is your provider's cost, not OpenCode's.
The data dashboard itself is a strategic asset. By publishing real usage data, OpenCode gives the community something benchmark leaderboards can't: signal on which models people actually keep using after they try them. That's a different question than which model scores highest on SWE-bench.
What to watch in the data
A few things worth tracking now that unique user rankings are live:
- MiniMax M3 is up 150% in token volume week-over-week -- the unique user chart will show whether that's broad adoption or a few heavy users
- Kimi K2.7-code is listed as "New" and already at 532B tokens -- user count will reveal if it's getting real traction or just high-volume testing
- Market share by lab currently shows Moonshot at 47.1%, DeepSeek at 23%, Zhipu at 10.5%, and Qwen at 9.1% -- but those are token shares, not user shares, and the gap between the two is exactly what this update is designed to surface
The OpenCode Data page is free and public. If you're evaluating which model to default to in your own agentic setup, the unique user leaderboard is now the most honest signal available from real production traffic.
Comments