NVIDIA Ships dcgm-exporter With Per-Process GPU Visibility for MIG Clusters
NVIDIA's dcgm-exporter 4.5.3-4.8.2 adds per-process GPU metrics, improved health reporting, and MIG job label support for Kubernetes clusters.
 PRO
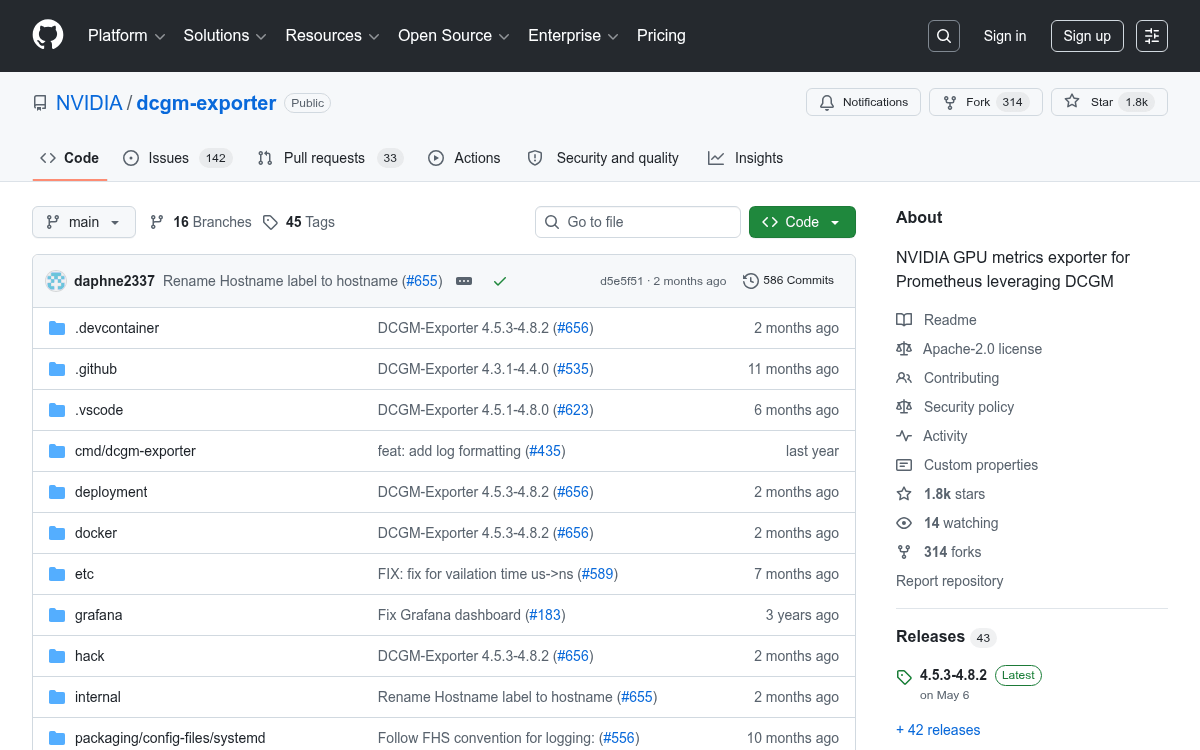
- Release 4.5.3-4.8.2 is out: NVIDIA shipped a new version of dcgm-exporter, its open-source Prometheus GPU metrics exporter.
- Per-process metrics added: GPU utilization can now be attributed to individual processes inside MIG partitions and time-shared GPUs.
- Improved health reporting: The exporter now surfaces GPU-wide health incidents like fallen-off-bus XID errors.
- MIG + HPC job labels: HPC schedulers can now tag metrics with job IDs on MIG-partitioned GPUs.
- Security improvement: The
/debug/pprofprofiling endpoint is now opt-in, not always-on. - Free and open-source: Apache 2.0 licensed, deployable via Docker or Helm in under a minute.
NVIDIA's dcgm-exporter just shipped release 4.5.3-4.8.2, its latest update to the open-source Prometheus exporter for GPU telemetry. The project, which sits between NVIDIA's Data Center GPU Manager (DCGM) and your monitoring stack, has been quietly becoming the standard way to observe GPU clusters at scale. This release brings meaningful changes to health reporting, per-process visibility, and Kubernetes integration.
What DCGM-Exporter actually does
DCGM Exporter bridges the gap between NVIDIA's Data Center GPU Manager (DCGM) and Prometheus-based monitoring systems, enabling comprehensive GPU observability in containerized and Kubernetes environments. In practice, it runs as a lightweight sidecar or DaemonSet on every GPU node, scraping raw hardware counters from the DCGM daemon and exposing them at an HTTP endpoint that Prometheus can scrape.
It is a tool based on the Go APIs to NVIDIA DCGM that allows users to gather GPU metrics and understand workload behavior or monitor GPUs in clusters, written in Go and exposing GPU metrics at an HTTP endpoint (/metrics) for monitoring solutions such as Prometheus.
It can be run as a standalone container or deployed as a DaemonSet on GPU nodes in a Kubernetes cluster.
What's new in 4.5.3-4.8.2
The headline changes in this release touch three areas that matter most for production GPU clusters:
- Better health incident reporting.
This story is for Pro members
You've reached the end of the free preview. Upgrade to AlphaSignal Pro to read the full article - and everything else behind the paywall.
Comments