Artificial Analysis Exposes How API Providers Quietly Degrade Model Accuracy
Artificial Analysis launches the Endpoint Accuracy Index, revealing how much model intelligence providers silently trade away for speed and cost savings
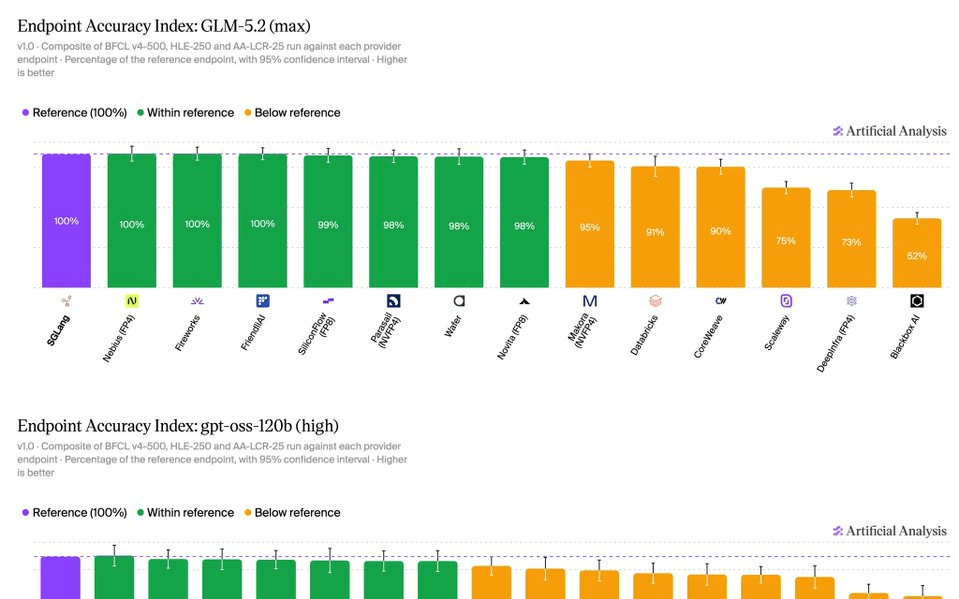
- New index launched: Artificial Analysis's Endpoint Accuracy Index measures how much of a model's accuracy each API provider preserves vs. a self-hosted reference.
- Three benchmarks: Tool calling (BFCL v4-500), hard reasoning (HLE-250), and long-context recall (AA-LCR-25), equally weighted at 33% each.
- GLM-5.2 finding: The most restrictive provider endpoints score half the reference or less on hard reasoning due to output token limits cutting off reasoning mid-chain.
- gpt-oss-120b finding: Tool call handling varies wildly -- some endpoints score 22% on BFCL-500 vs. 37% for the reference deployment.
- DeepSeek V4 Pro finding: Most endpoints are at reference parity; DeepSeek's own API scores slightly above the reference.
- Coverage is live for GLM-5.2, gpt-oss-120b, and DeepSeek V4 Pro; Kimi K3 coming soon.
When you call a model API, you assume you're getting the model. Often you are not. Providers quantize weights to lower precision, cap output token limits, tune sampling defaults, and sometimes ship bugs. The same model can behave very differently depending on who serves it. Artificial Analysis just launched an index that puts a number on exactly how much accuracy each provider endpoint preserves.
What the Index Measures
The Endpoint Accuracy Index measures how a model's intelligence and capability vary across the API providers serving it. Quantization, sampling defaults, context handling, token limits, and prompt parsing all introduce differences between what the model lab ships and what you actually call.
Artificial Analysis self-hosts each model as a reference deployment, then expresses each provider endpoint's score as a percentage of that baseline. A score of 100% means the endpoint matches the reference; anything lower reflects accuracy lost to endpoint-side configuration. Each result carries a 95% confidence interval computed from per-repeat variation, and endpoints are flagged as either statistically within the reference or significantly below it.
Three Benchmarks, Each Targeting a Different Failure Mode
- BFCL v4-500 (tool calling): A 500-task subset of the Berkeley Function Calling Leaderboard, weighted toward the hardest categories including multi-turn and parallel tool calls. Run with 3 repeats.
- HLE-250 (hard reasoning): A 250-question subset of Humanity's Last Exam, an expert-written frontier benchmark spanning mathematics, natural sciences, and the humanities. Run with 10 repeats.
- AA-LCR-25 (long-context recall): Tests reasoning across multiple long documents, roughly 100k input tokens per question, weighted toward the harder questions. Run with 10 repeats.
All endpoints run under standardized settings: the temperature recommended by the model lab, the highest reasoning mode the endpoint supports, and the maximum output tokens and context window the endpoint allows.
How the Reference Deployment Works
Each reference run is a self-hosted deployment using vLLM or SGLang, configured to the model lab's recommended settings and served at the highest recommended inference precision. The DeepSeek V4 Pro reference runs on 8x NVIDIA B200 GPUs with SGLang using native W4A8 MoE precision. The gpt-oss-120b reference uses native MXFP4 with FlashInfer kernels. Full launch commands are published alongside each result.
What the First Results Show
The index launches with three models: GLM-5.2, gpt-oss-120b, and DeepSeek V4 Pro. Each tells a different story about where provider serving stacks break down.
GLM-5.2 is most damaged by restrictive output token limits. When a provider caps tokens too aggressively, the model gets cut off mid-reasoning, and the most restrictive endpoints score half the reference or lower on HLE-250. Fifteen providers serve GLM-5.2, with blended prices from $0.61/M tokens (DeepInfra FP4) to $1.70/M tokens (Nebius FP4) and output speeds ranging from 38 t/s to 453 t/s.
gpt-oss-120b shows the sharpest divergence in tool call handling. Providers parse and format tool calls differently, and some endpoints score 22% on BFCL-500 against 37% for the reference. Several endpoints also generate far fewer reasoning tokens at the same configured level, and restricted context windows truncate long-context tasks. Nineteen providers serve this model, with Cerebras reaching 1,924 t/s and DeepInfra offering the cheapest access at $0.05/M tokens blended.
DeepSeek V4 Pro is the most consistent across providers. Most endpoints land at reference parity, and DeepSeek's own first-party endpoint scores slightly above the reference. Ten providers serve it, with DeepSeek's own API the cheapest at $0.18/M tokens blended.
A Third Axis Alongside Price and Speed
For agentic and reasoning-heavy workloads, provider choice silently shapes results. Pipelines that call tools, process long documents, or depend on extended chain-of-thought are all exposed to endpoint-side accuracy loss. The cheapest or fastest endpoint is not always the one that preserves the model's actual capabilities.
The index gives you a concrete way to compare providers on accuracy, not just cost and throughput. For workloads where accuracy is the binding constraint, you can now see which providers deliver the model you're paying for and which trade intelligence for speed.
Models enter coverage once enough providers serve them and exit when a newer version in the same family supersedes them. Kimi K3 accuracy coverage is launching soon. The index is live at the Artificial Analysis provider pages for each covered model.
Comments