
If you've ever shipped a Lovable app and immediately wondered whether anyone was actually using it, that problem just got a lot smaller. Lovable has rolled out a built-in analytics dashboard that activates automatically when you publish a project, no third-party scripts, no manual instrumentation, no configuration required.
Zero setup, instant signal
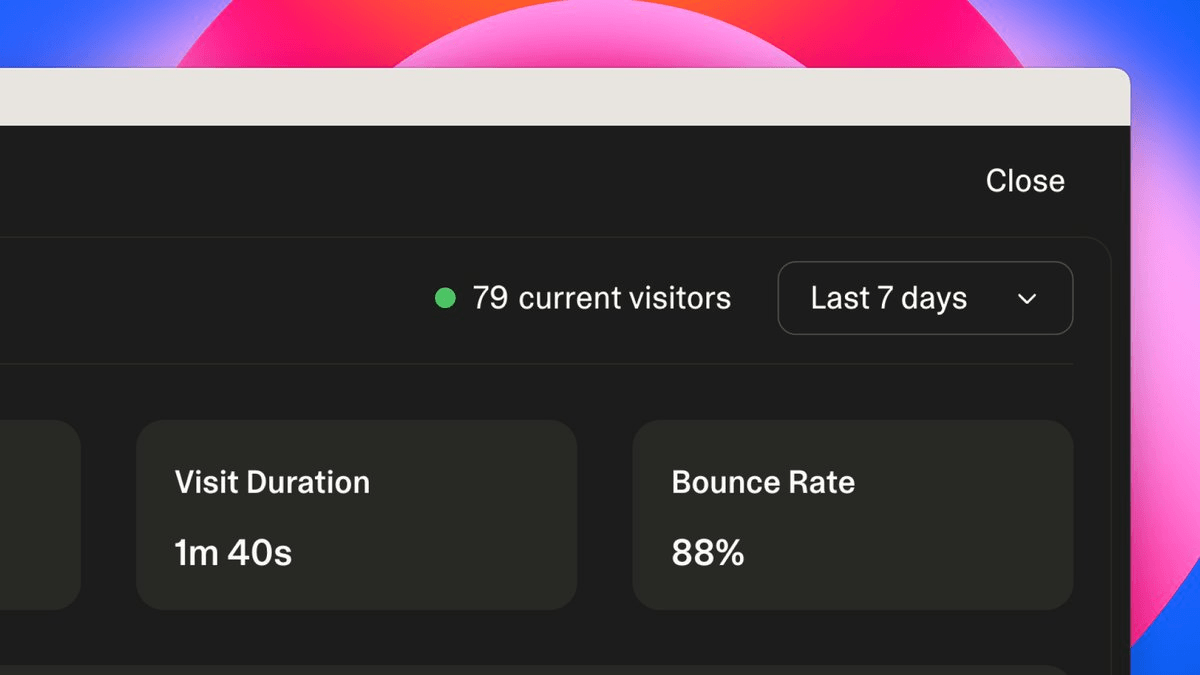
The dashboard tracks visitors, pageviews, bounce rate, visit duration, traffic sources, and device usage for published projects. It's live the moment your app goes public. By default, analytics data is shown for the last 7 days, and you can change the time period using the dropdown at the top of the Analytics view.
The full range of time filters available:
- Today
- Yesterday
- Last 24 hours
- Last 7 days (default)
- Last 14 days
- Last 30 days
- Last 90 days
- This month
What you actually get
The dashboard is organized around four core views, each answering a distinct question about your traffic:
- Real-time visitor count -- live headcount of who's on your app right now, updating as traffic moves


Don't miss what's next in AI
Join 300,000+ engineers and researchers who get the signal, not the noise.
- Full access to in-depth AI research breakdowns
- Be the first to know what's trending before it hits mainstream
- Daily curated papers, repos, and industry moves